Case Study: Finding a non-technical way to filter reporting data using GV Design Sprint
My role
- UX Lead
My contributions
- Design Sprint Master
- Prototype Design
Overview
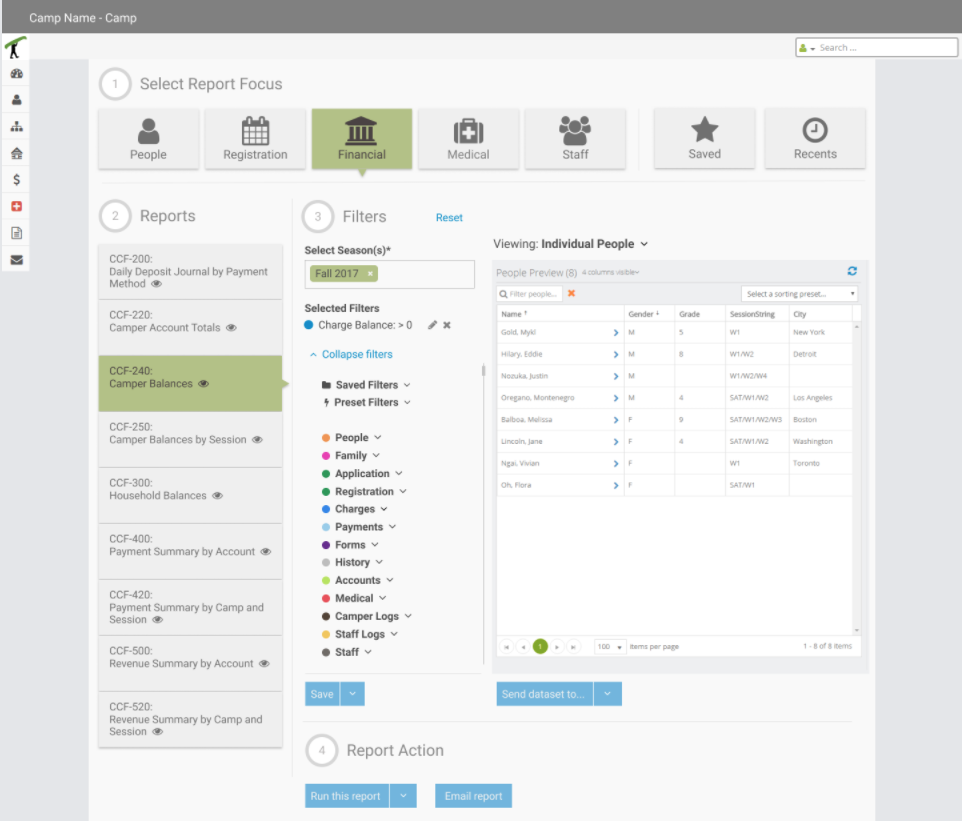
CampBrain’s robust reporting system relies on dozens of standard reports and thousands of custom ones to get data from the system. By data I mean the exact set of information for an exact set of people, over and over again.
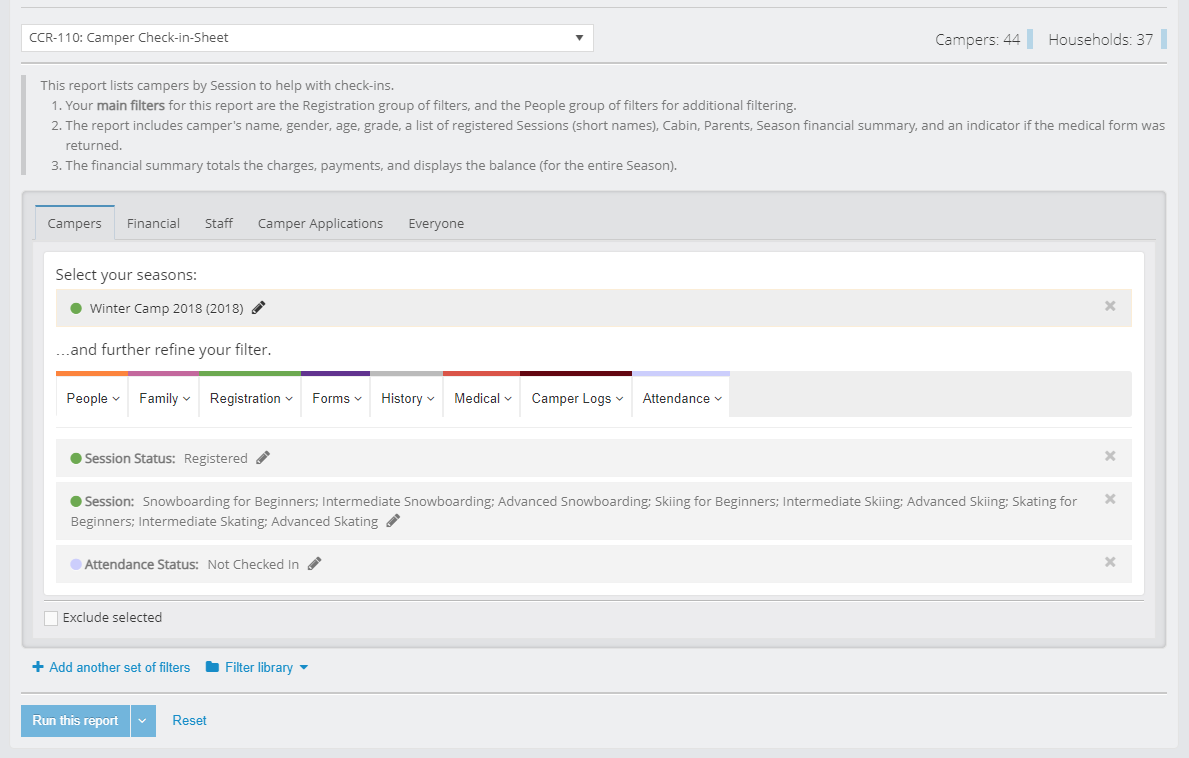
The key interface between the user and that data are reporting filters – a large set of SQL limit queries, categorized by data type.
Once all the filters are applied, users can choose to run the report, which which sends a query to the reporting server behind the screens, which will produce a PDF with data limited by those queries.
The Problem
This approach was adopted from the legacy desktop system with no redesign in mind at that time, meaning that the interaction continued favouring technical, “left-brained” people in capturing the intent.
In the course of those first few years since the SaaS was launched we started getting some negative feedback from the customers, and it only grew more frequent and louder, indicating some serious usability issues.
“People are confused, there are too many calls to Tech Support.”
“The thing they intend to get is not what they get.”
“No confidence in results (trust).”
“Too cumbersome, particularly for simple tasks.”
Notes from our internal DB
An opportunity to do something about it presented itself as an ideal candidate for a large, cross-departmental Design Sprint session, and I couldn’t be happier that I was given the reigns to organize and facilitate this exercise.
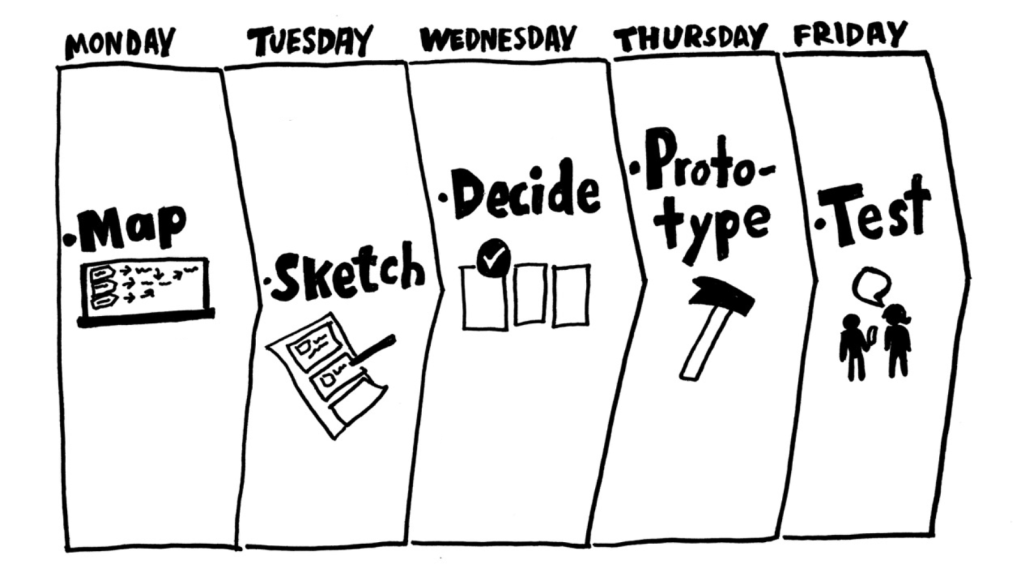
The Design Sprint Methodology
For those who are hearing about Design Sprints for the first time, it’s basically a framework for teams to solve and test design problems in 5 days introduced by Jake Knapp and his fellow design partners from the Google Ventures in a great book I got to read and digest a year before.
I made the decision to follow the methodology to the letter, since that was something that authors recommended (after having run 150 of the sprints). My plan was to use that sprint experience as a baseline for future ones and to adjust it accordingly.
The leadership approved 11 people for 2.5 days, 6 people for 4 days, but the UX team could remain on task for a whole week.
Day 1: Understand and Define.
What are the user needs, business needs
and technology capacities? What is the key strategy and focus?
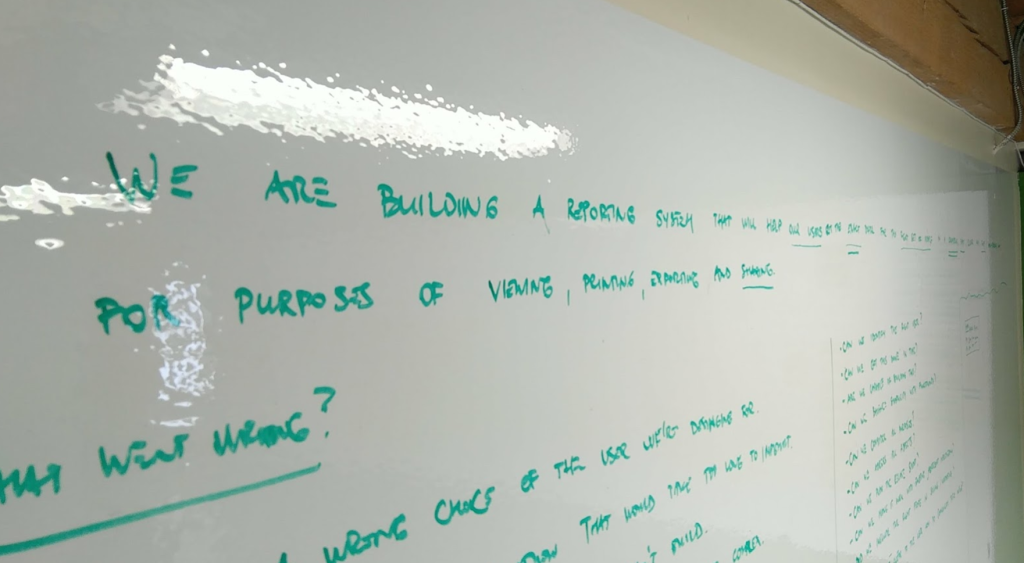
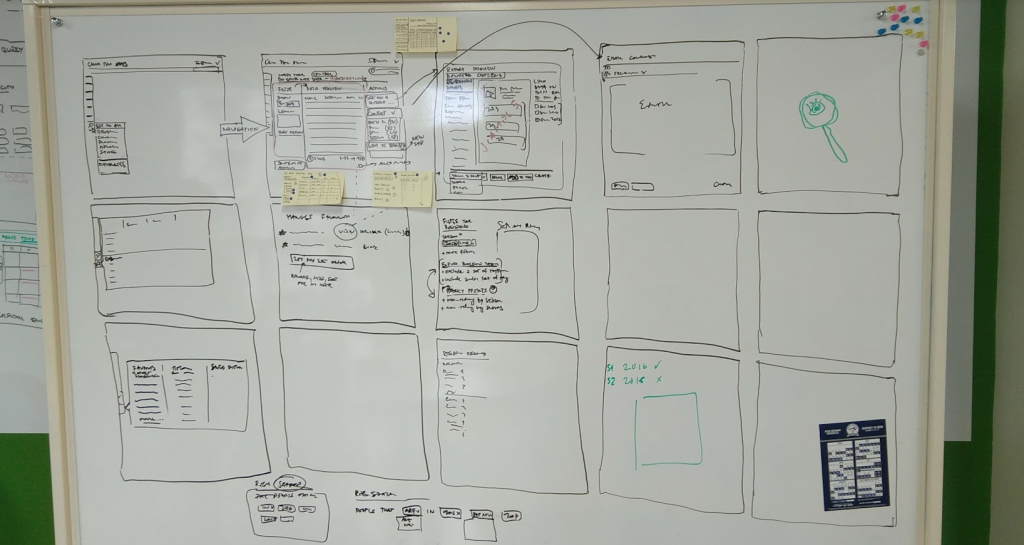
After collaborating on setting a long-term goal, the team created a list of (pessimistic) sprint questions, and made a map.
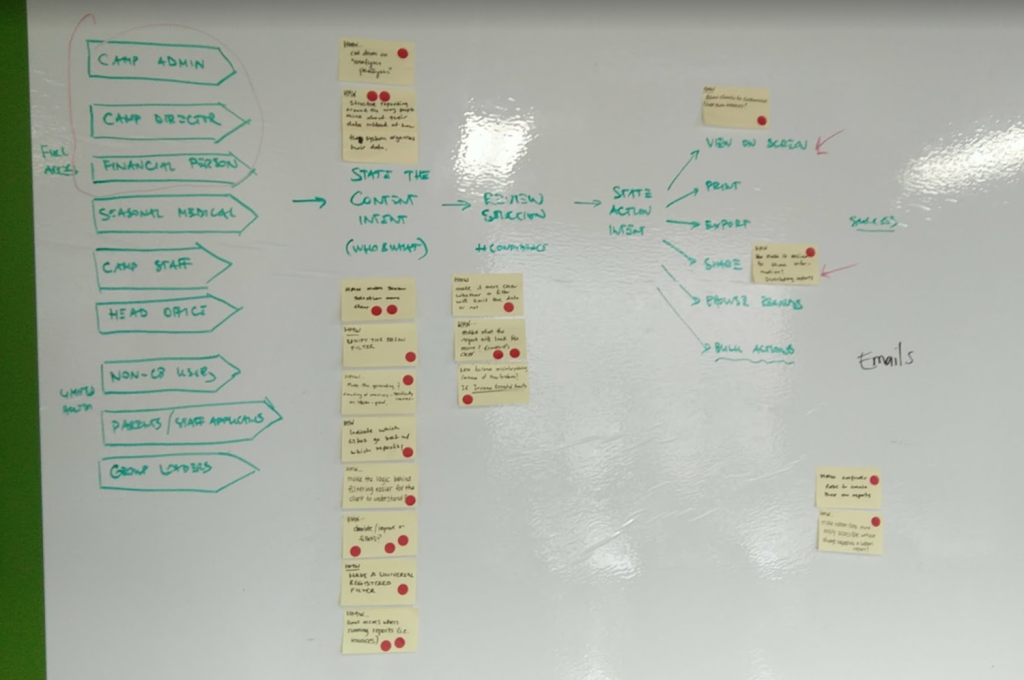
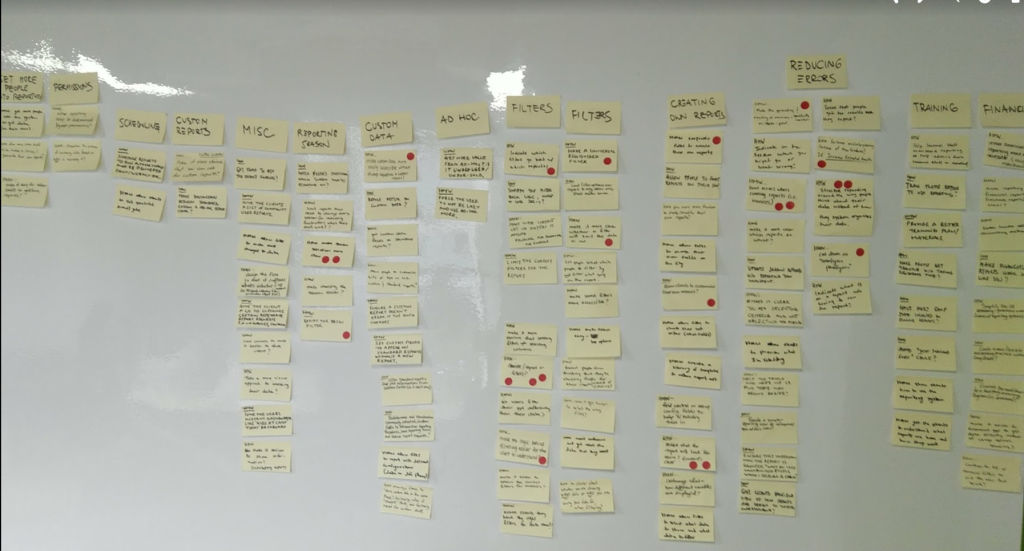
Next, a detailed analysis of our user feedback database was conducted to identify key issues, categorize them, and define topics to address.
Expert Interviews were conducted with:
- Members of Product and Sales teams, to reflect on that first contact and first impressions potential clients had regarding reporting and filtering, and to gauge users’ expectations, i.e. what was the need, and what did we promise?
- Two members from the Implementations team in charge of the onboarding process, and training users on how to form those requests for data by using reporting filters. We were interested in mental models they encountered, and how people “graduated” from that training session.
- Head of Tech Support, to reflect on calls their department was getting and provide more insights and context into the data that was collected so far.
- Head of Reporting and one of his staff, to identify key actors that they had to assist, and to grasp the technical side and frequency of issues that are landing with their department to handle.
The main target and use case was identified, which concluded the first day, and people went home energized, feeling that great progress was made.
Lastly – and this was not a part of the official Sprint – I performed a Heuristic Evaluation of the reporting system, and prepared a System Usability Score (SUS) online form for a subset of clients we would include in the redesign process to capture the “before” state.
Day 2: Diverge.
How might we explore as many ideas as possible?
The whole group reconvenied in the morning, and started one of the activities that turned out the be a hit: Lightning Demos. Everyone thought of a great design, as a solution in a digital product they use, and got 3 minutes to present it to the group and talk about what makes it great in their opinion.
Circling back to the map, the target audience and key use case, people were tasked with a Four-Step Sketch assignment: Notes, Ideas, Crazy 8s, and Solution. These took place in 20-20-8-60 minute intervals, where best ideas from the previous activity were taken into the next round for refinement.
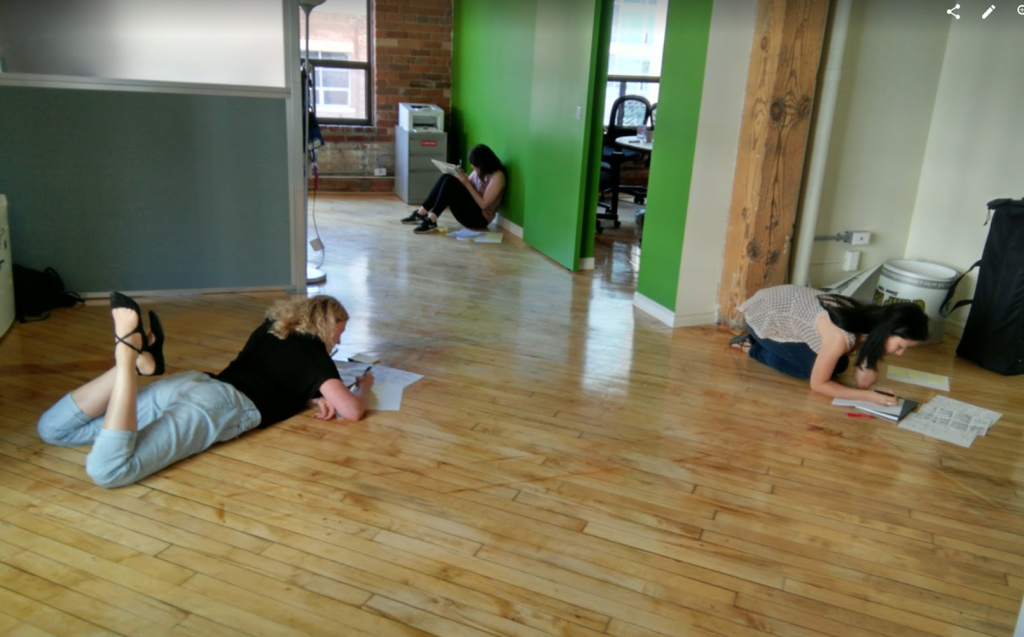
I would call this the most creative, productive – and neurodiverse! – day in the whole process, where people were given a task, and allowed time to work in their own space and at their own pace. Once finished, people submitted their assignments into a folder for tomorrow.
Day 3: Decide.
Select the best ideas so far.
The day began with an Art Museum – we taped solutions to the wall for Silent Reviews, Dot Voting, Speed Critiques, and a Supervote by our Head of Product.
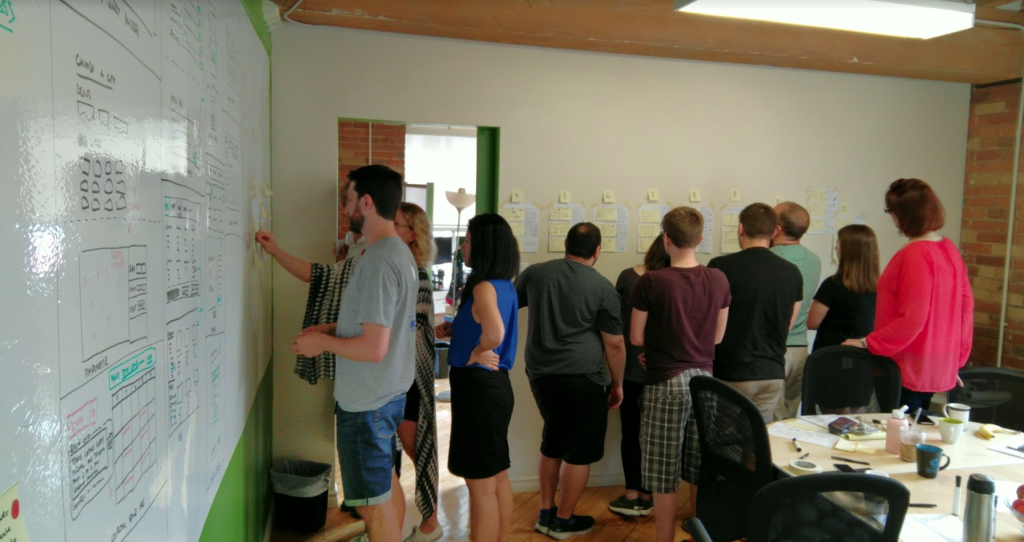
It was amazing seeing everything coming together, and the energy in the room still at a very high level. At this point we reduced the group size in half, because of the operational cost, but this was planned from the beginning.
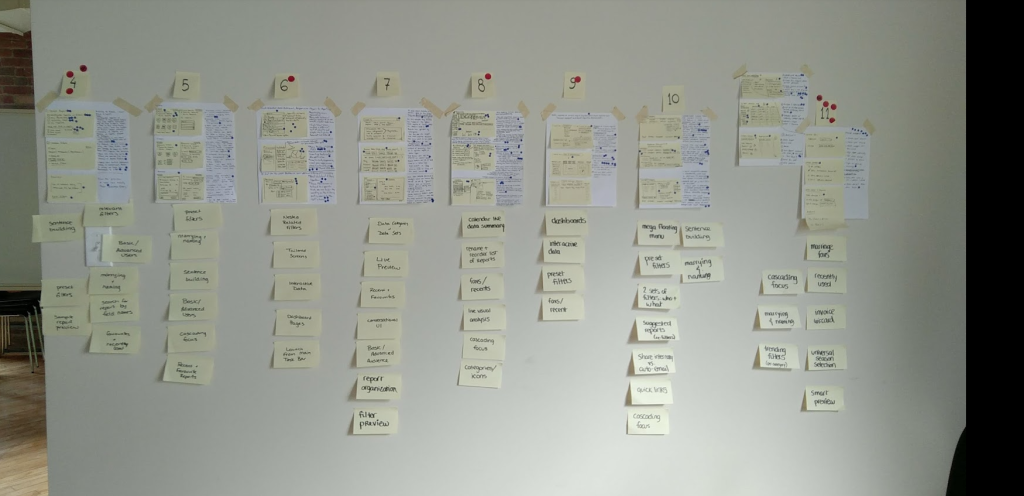
Leading ideas and designs surfaced, and we went onto making Storyboards for the winning ideas.
We ended up adopting two approaches that will make it into tomorrow’s Prototype building task.
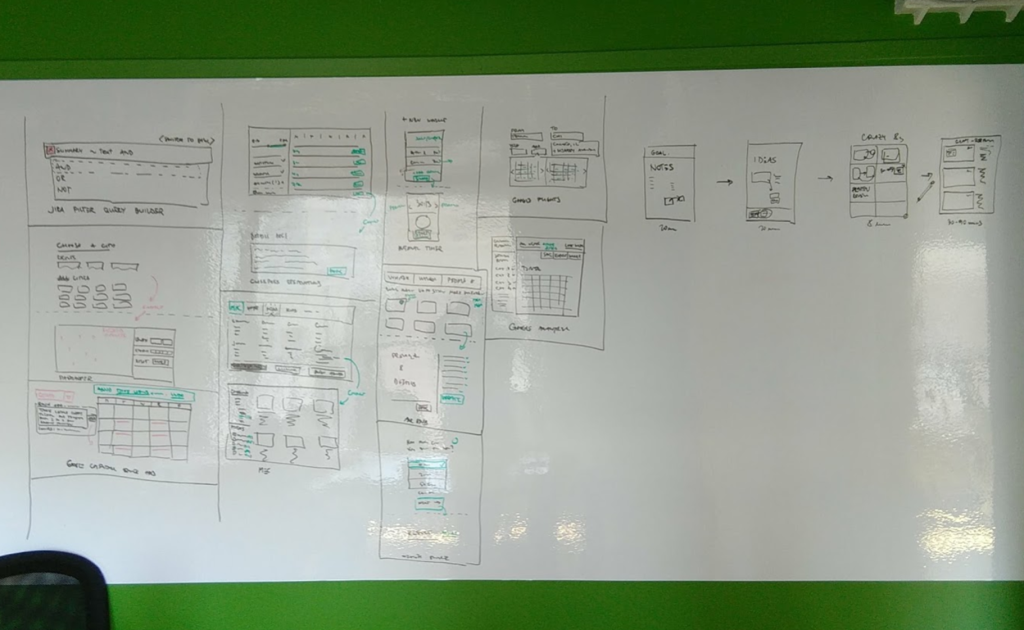
Day 4: Prototype
Create an artifact that allows testing the ideas with users.
We split the prototyping tasks between myself and our Interaction Designer, to spend the day as effectively as possible.
Both solutions shared similar concepts: progressive disclosure, cascading choices, constant feedback on how filters are affecting the data.
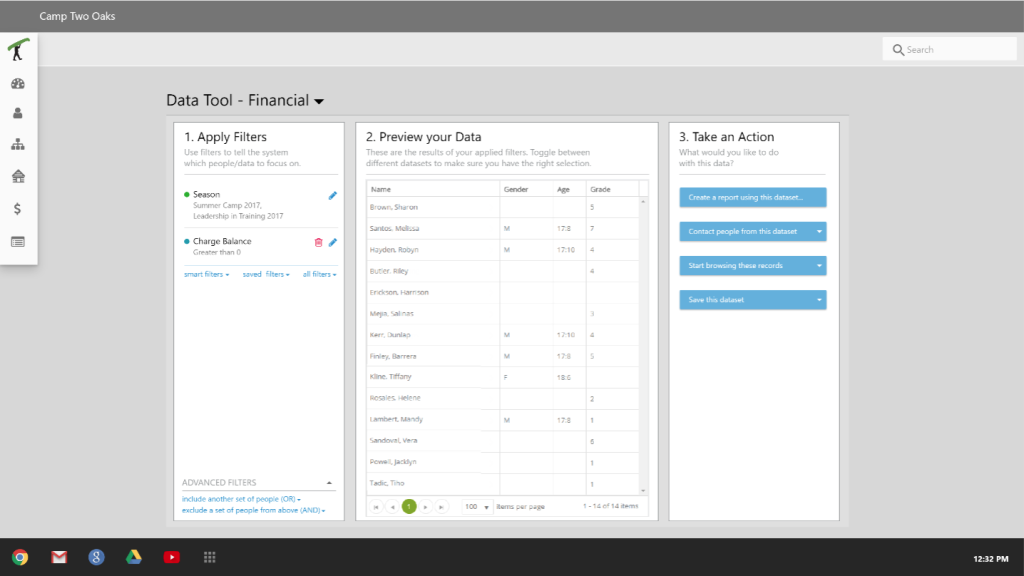
The second solution went above the reporting needs, and introduced the idea to send data where needed: generate report, email people, text them, browse their records, etc.
Day 5: Validate.
Test the ideas with users, business stakeholders, and technical experts.
Camp industry is cyclical; it takes 6 months to prepare for camper arrival, 3 summer months to host them, and the rest of the year to wrap the year up, and start planning the next. Our Sprint came smack in the middle of that 3 month blackout when camps do not have time to be contacted for anything, including testing out our prototypes, so we never got to put this in front of our clients.
We did test internally, however, and we got some solid feedback to improve the next version of the prototype, and an even split (5:5) on which solution is better suited for our customers.
(https://www.linkedin.com/feed/update/urn:li:activity:6909872035263299584/)
Nevertheless, at the time of writing this article (March 2022) the team at CampBrain is undergoing a major redesign of the front-end, and I have a feeling that this testing might happen after all.
Retrospective
I must say that I learned a lot in this week; I employed these new techniques and methodologies in later design sessions like Charrettes and Sprint Zeros.
It works.
Rarely does a workshop with more than 6 people produce this much goodness. A good night’s rest in between major stages is incredibly helpful. At the end, I didn’t find one thing that should be scrapped in the future.
Follow the script.
Resources are expensive.
I was trying to pitch the benefits of this exercise for a while, and in worked only when company was able to spare some resources, and even that was negotiated in 1/2 day increments.
Smaller sell is easier.
Actual testing
is key.
It was demotivational to reach the final stage of the process, and then not be able to put it in front of our users. While I personally valued the time and experience, I felt that the company didn’t get as much as it would have from the actual user testing.
Start by securing end users for prototype testing.